System Components
A comprehensive breakdown of all hardware, software, and infrastructure components that constitute the groundwater and drinking water environmental monitoring system, including their roles, interfaces, and performance requirements.
1.1 System Architecture
The monitoring system is decomposed into four primary subsystems, each with clearly defined boundaries, responsibilities, and interfaces. Understanding this decomposition is essential for procurement planning, integration design, and acceptance testing. The architecture distinguishes between core components that are mandatory for any deployment and optional components that enhance capability for specific site conditions or risk levels.
The Field Stations subsystem encompasses all equipment deployed at monitoring points — groundwater well stations and drinking-water node stations. The Edge/Network subsystem provides secure, resilient data transport between field stations and the central platform. The Platform/Data subsystem delivers all data management, quality assurance, alarming, and reporting functions. The Operations & Compliance subsystem supports ongoing maintenance, calibration management, and regulatory audit readiness.
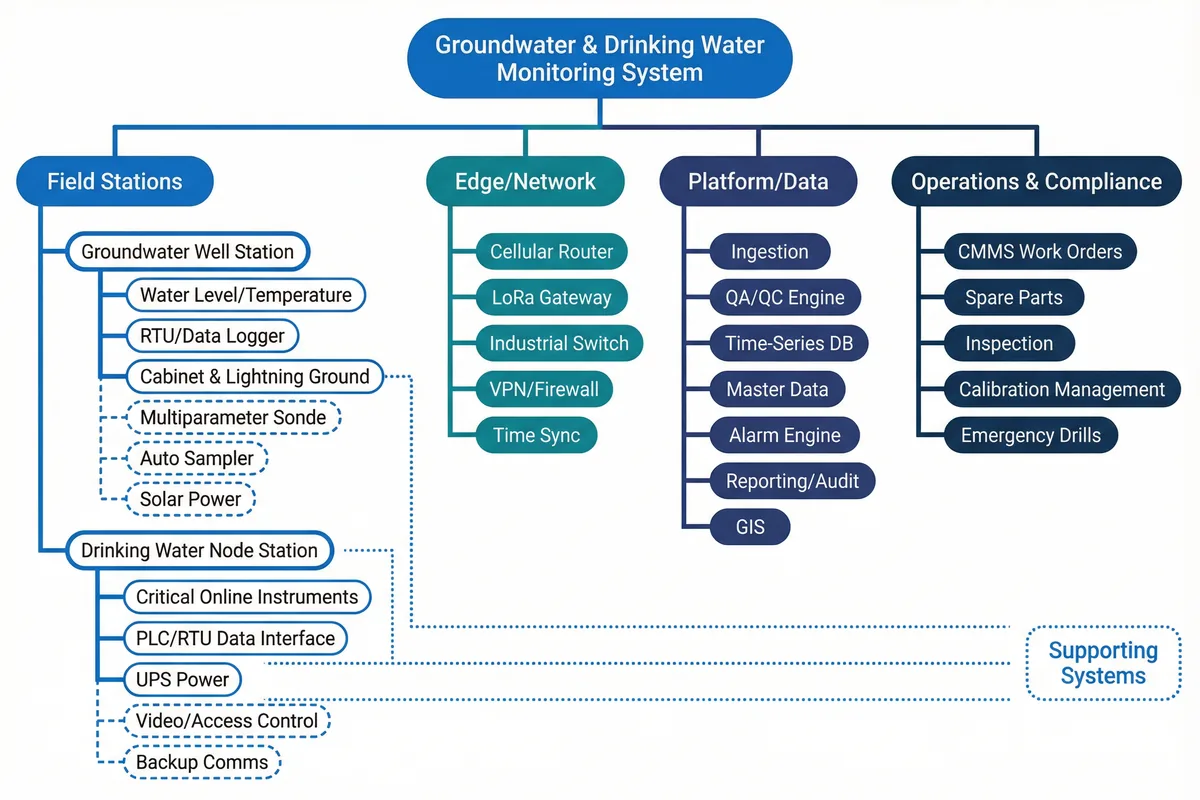
Figure 1.1: System Architecture Decomposition — Tree Structure Showing Core and Optional Boundaries
Deployment boundaries are clearly marked: solid lines indicate core components that must be present in all deployments; dashed lines indicate optional components that are recommended for high-risk or high-criticality sites. Supporting systems — including UPS, lightning protection, and cabinet/enclosure infrastructure — are shown separately to emphasize their enabling role without conflating them with the monitoring system itself.
Module Relationships & Deployment Boundaries
The core deployment boundary includes sensors, data logger/RTU, communications equipment, platform ingestion services, QA/QC engine, time-series storage, alarm engine, and reporting module. Optional components include auto-samplers, video security, advanced analytics, and on-premises high-availability configurations. Supporting systems — UPS/power distribution, lightning and grounding, cabinet/enclosure, fire linkage, and physical security — are essential infrastructure but managed as separate procurement and acceptance items.
Key Data & Control Flows
- Telemetry is buffered at the RTU, then transmitted periodically or event-driven to the platform
- Platform applies QA/QC validation before data becomes "reportable" or triggers alarms
- Alarms generate work tickets and can trigger "increase sampling frequency" tasks at field stations
- Calibration records and lab reports are archived with immutable timestamps for audit evidence
1.2 Parts List & Responsibilities
Each component in the monitoring system has a defined primary duty, specific input requirements, measurable output characteristics, and key performance indicators. Understanding these relationships is critical for system integration and for diagnosing mismatches that lead to data quality issues or reliability failures. The diagram below illustrates the input/output relationships for all major components.
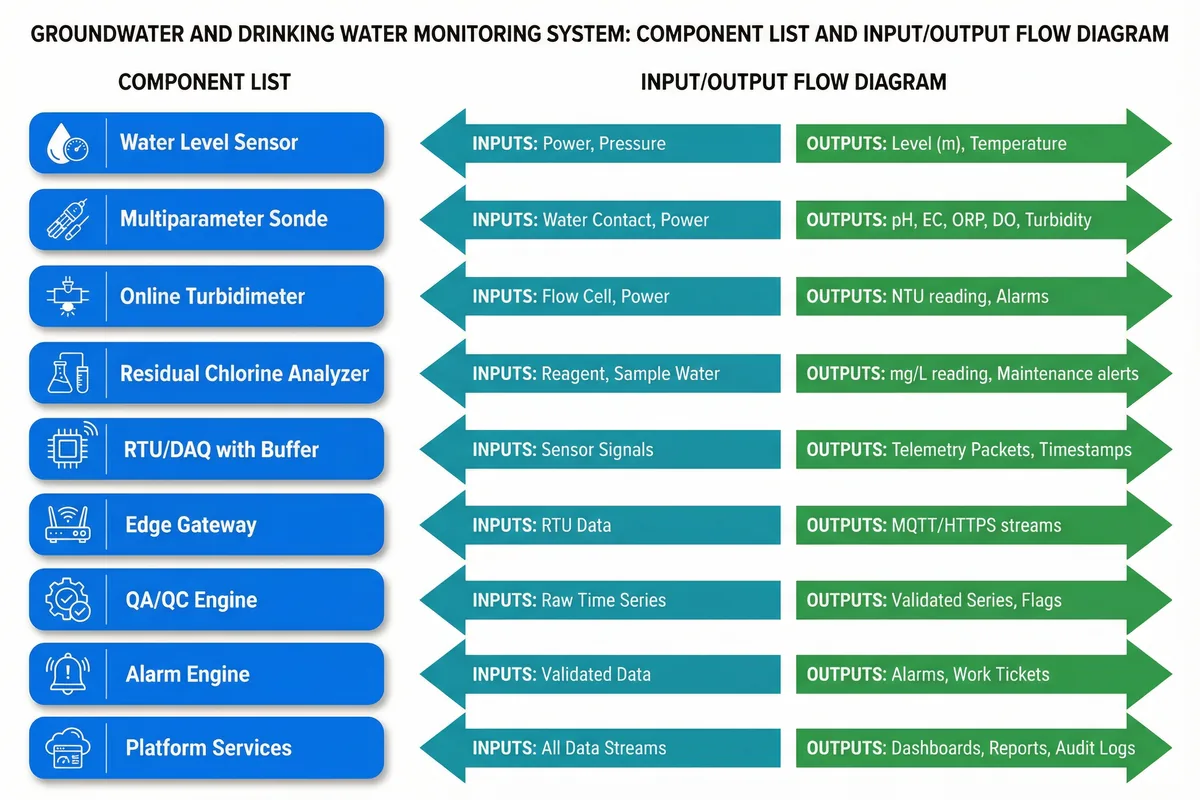
Figure 1.2: Component Parts List with Input/Output Flow — Showing Data and Signal Relationships for All Major Components
The table below provides detailed specifications for each component, including primary duties, inputs, outputs, key performance indicators, and the most common mismatch risks that lead to field failures or data quality problems.
| Component | Primary Duty | Inputs | Outputs | Key KPIs | Common Mismatch Risk |
|---|---|---|---|---|---|
| Water Level Sensor (vented or absolute) | Continuous water level measurement | Power, pressure | Level (m), temperature | ±0.01–0.05 m accuracy; drift <0.02 m/month | Wrong venting → barometric error; cable damage |
| Groundwater Sonde (pH/EC/ORP/DO/Turb) | In-well water quality trend monitoring | Water contact, power | Multi-parameter readings | Stability, antifouling interval (days) | Fouling, wrong flow cell, poor representativeness |
| Grab Sampling Kit + CoC | Compliance sampling with chain-of-custody | SOP, bottles, labels | Lab results, custody records | Completeness, custody integrity | Broken CoC → inadmissible evidence |
| Online Turbidimeter | Process turbidity measurement | Flow cell, power | NTU reading, alarms | 0–1000 NTU range, ±2% accuracy | Bubble interference, wrong bypass flow rate |
| Residual Chlorine Analyzer | Disinfection control monitoring | Reagent, sample water | mg/L reading, maintenance alerts | Uptime ≥99%, response time <5 min | Reagent depletion, membrane aging |
| RTU/DAQ with Buffer | Acquire, timestamp, store, and transmit data | Sensor signals | Telemetry packets | Buffer ≥7–30 days; clock drift <30 s | Clock drift, insufficient local storage |
| Edge Gateway | Protocol conversion and secure transport | RTU data | MQTT/HTTPS streams | Secure tunnel uptime ≥99.9% | Weak cipher suites, NAT traversal issues |
| QA/QC Engine | Flag bad data before reporting | Raw time series | Validated series, flags | False positive rate <1% | Overly strict rules hide real events |
| Alarm Engine | Detect anomalies and dispatch notifications | Validated data | Alarms, work tickets | Latency <1–5 min (plant nodes) | Bad thresholds cause alarm storms |
1.3 Working Principles
Startup Sequence
System startup follows a defined commissioning sequence to ensure all components are properly configured and verified before operational data collection begins. Each step must be completed and documented before proceeding to the next.
- Asset Registration: Register all monitoring points with unique IDs, coordinates, well construction data, and process metadata in the platform master data registry.
- Sensor Commissioning: Install and verify all sensors, checking physical connections, signal integrity, and initial readings against reference measurements.
- Calibration Baseline: Perform initial calibration for all sensors, record certificates with serial numbers and expiry dates, and upload to the platform.
- Connectivity Test: Verify end-to-end data transmission from each field station to the platform, including VPN tunnel establishment and protocol handshakes.
- Time Synchronization: Confirm NTP or GNSS time sync at all RTUs, verify time offset is within specification (≤2 s for plant nodes, ≤30 s for wells).
- Platform Ingestion Verification: Confirm data is appearing correctly in the platform time-series database with correct units, point IDs, and timestamps.
- QA/QC Rule Activation: Enable and test all QA/QC rules, verify that known-bad data inputs produce correct flags and do not generate false alarms.
- Alarm Dry-Run: Simulate alarm conditions for all alarm types, verify notification delivery to all configured recipients within latency targets.
Normal Run Cycle
During normal operation, the system executes a continuous cycle: periodic sampling or continuous measurement at field stations → edge buffering and secure transmission → platform QA/QC validation → trend dashboards and scheduled reports → alarm evaluation and escalation as needed. The cycle frequency varies by station class and parameter criticality, from continuous (1-second) for critical plant nodes to 15-minute intervals for remote groundwater wells.
Exception Handling & Recovery
The system defines four primary exception chains, each with specific detection, behavior, and recovery procedures to maintain data integrity and operational continuity.
| Exception Chain | Trigger | System Behavior | Recovery Action |
|---|---|---|---|
| Chain 1: Sensor Drift/Fouling | Comparison to lab samples or redundant sensor shows divergence | Flag data as "suspect," create calibration work ticket, optionally hold last-known-good for alarm evaluation | Field cleaning/calibration, close ticket with evidence, unflag data after verification |
| Chain 2: Comms Outage | No data received from RTU beyond threshold (30–120 min) | RTU local store-and-forward; raise comms alarm; resend backlog upon recovery with original timestamps | Comms restoration, backlog upload, gap analysis report |
| Chain 3: Cabinet Intrusion/Tamper | Tamper switch triggers high-severity alarm | Mark data with "integrity risk" tag; require site verification and photo evidence before closing | Site inspection, photo documentation, seal replacement, alarm closure with evidence |
| Chain 4: Analyzer Reagent Empty | Analyzer self-diagnostic triggers "maintenance required" | Alarm engine switches to secondary measurement or increases grab sampling frequency task | Reagent resupply, prime line, verify readings against grab sample before returning to service |